Blog III - ETL with Google Analytics data
Module 2 gave us an introduction into web analytics as well as how to use Google Analytics to help track and analyze our web data. The lecture defined web analytics as "The measurement, collection, analysis, and reporting of internet data for the purpose of understanding and optimizing web usage".
The lecture also introduced the following diagram showcasing the Web Analytics Life Cycle. I felt this was very important because it shows that the process of making data driven decisions is iterative and not just "1 and done".

The lecture also introduced the following diagram showcasing the Web Analytics Life Cycle. I felt this was very important because it shows that the process of making data driven decisions is iterative and not just "1 and done".
When one starts to dig into their web analytics data they should be keeping the 5 W's in mind:
- What are the users doing on your website?
- Who are they?
- When are they visiting?
- Where are they coming from?
- Why are they doing this?
To answer these questions we have to use a mixture of different metrics and dimensions. Some examples are types of web traffic, number of visitors, exit rates, and bounce rates. Also, like the balanced score card we should have goals and KPIs set to ensure the website is performing how we'd expect. Some metrics that help here are conversion rates, average order value, task completion rate, and share of search.
Web analytics is an important tool to use, especially with how integrated the web is with our daily lives. With the help of tools like Google Analytics this information can be obtained for free and can be set up with little technical knowledge. While one can get meaningful data out of web analytics, I feel like it's important to look at business processes as a whole. So how can we compare the results of our web traffic with other aspects of the business? Well with the help of Googles Analytics API and an ETL tools like Pentaho Data Integration we can load our web analytics data into a data warehouse.
Sadly I wasn't able to get an API key for my assignment. But I'd still like to introduce you to the tools needed and how you can try it out on your projects.
Things you'll need:
2. Google Analytics API Key. The approved method Pentaho supports can be found here.
3. The ability to add your Google Service account as Read and Analyze user to the Google Analytics dashboard
Once you have the above three things covered you can launch Pentaho and start! To begin create a new canvas and drag the Google Analytics step from the Input folder onto the canvas.

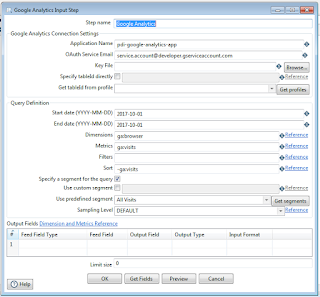
Once your step is on the canvas double click it. Then you should see the dialog below. The first section, Google Analytics Connection Settings, is where you put the information generated from the link for setting up the API key. Query Definition is where all the magic happens. PDI uses the Google Analytics API 3.0 for query generation. However, Google has since released 4.0 so some of the newer functionality will be left out. For the most part, 3.0 will do just fine! The reference guide can be found here and will show you how to format your strings. The default strings shown below are a good example on how they're formatted. The last section is how your define the fields you want returned from the query and how they should be named in the stream. This can be done manually or automatically by clicking the "Get Fields" button at the bottom.

Now from here the world is your oyster! The above really just shows the E(xtract) part of ETL but feel free to play with the other steps available to transform your data. Not many of us will have access to a data warehouses to practice loading into but as you'll see in the output folder there are plenty of different formats to use. Text File Output is my recommendation as it'll allow you to create a CSV file with your data. Along side of JSON this file format is one of the most used for transferring, loading, or analyzing raw text files. That's about all I'll cover for this blog post but if anyone does try out PDI and has any questions just let me know! I'd be happy to help.
Great post. It never would have occurred to me to dump the GA data into the DW for additional analysis. But it's a fascinating approach and seems like a brilliant way to gain competitive advantage. Not only is the web traffic important but when leveraged against other institutional data, it could be the missing link that allows a business to grow beyond a current cap in revenue and customer base. Professor Ram said that data is the "hot" industry to be in and between 545, 531, and 587 I am really considering a complete change in my career choice. Thanks for posting!
ReplyDeleteOh for sure! Combing that information with the other business systems you could look at how customers change in shopping from physical stores to online sales. It's crazy how much value can come from data. I guess it's true that they say data is the new oil ha. Have you taken 545? That's going to end up being my last class and I'm pretty excited. Working with data has been a lot of fun I'm sure you'd love the change!
Delete