Blog V - Course Overview and Reflections
These past 8 weeks flew by and it seems crazy I'm already wrapping up this class. MIS 587 was definitely packed with information and a challenging course, but I'm glad I took it and would recommend it as an elective to anyone in the program! Definitely makes me excited to enter back into the Business Intelligence (BI) world and start applying the concepts we covered.
Going into this class my view on BI was a bit skewed. One of my college internships was doing BI analysis with a tool called Cognos. So to me BI was just pulling data out of systems so that business users could access it. I couldn't have been more wrong! At the risk of over simplifying BI, I think it's easiest to understand the different sections by breaking it into the popular roles companies use on their teams: Data Architecture, Data Analysis, and Data Science. As it turns out, the different modules we covered fit with these pretty well.
Module 1 covered data warehouse design. This included topics such as the data warehouse design cycle, balanced scorecard, performance management, star schema design, data quality analysis, and dashboard design and analysis. I feel this module is extremely important to understand for anyone thinking of going into a BI career field. Data warehouses make up a large portion of BI ecosystems in companies. Doesn't matter if you're implementing a BI initiative, reporting out of existing infrastructure, or writing logic to move data from transactional systems into OLAP systems this section provides the base knowledge to do those jobs. Below is a YouTube video from O'Reilly that goes over the steps to create an agile data warehouse and matches the lecture materials very well.
One other thing to note for this section that I feel is important is the notion of traditional BI vs Modern BI. In my past blog post I provided an example of what a modern ecosystem would look like, but I'd like to go into a little more detail here. Traditional BI relies on purely static data inside data warehouse while modern BI still uses those systems but also introduces additional infrastructure for "streaming analytics". This is an attempt to make data driven decisions in the moment instead of after the fact. Here is an executive brief from Informatica introducing SA and it's benefits.

Once the network visualization is completed we can use the mathematical properties to help analyze the data. Such properties include: degree centrality, betweenness centrality, closeness centrality, eigenvector centrality, reciprocity, density, modularity, distances, and connected components. As mentioned before, tools like Gephi makes calculating these properties pain free but you still need to understand what they mean in order to properly use them. Personally I found this section to be the most eye opening and had never had much interest in data science techniques before. This sort of information analysis can be applied to all kinds of different industries and fields. Some examples from our lecture materials included optimizing the layout of the student unions as well as how diseases can travel through cells in the body. While these are very serious topics, network analysis can be applied to very light things such as pop culture. Here is an example from the Mathematical Association of America where these concepts were applied to George R.R. Martin's A song of Fire and Ice to identify who was the main character was of the book.
Going into this class my view on BI was a bit skewed. One of my college internships was doing BI analysis with a tool called Cognos. So to me BI was just pulling data out of systems so that business users could access it. I couldn't have been more wrong! At the risk of over simplifying BI, I think it's easiest to understand the different sections by breaking it into the popular roles companies use on their teams: Data Architecture, Data Analysis, and Data Science. As it turns out, the different modules we covered fit with these pretty well.
Module 1 covered data warehouse design. This included topics such as the data warehouse design cycle, balanced scorecard, performance management, star schema design, data quality analysis, and dashboard design and analysis. I feel this module is extremely important to understand for anyone thinking of going into a BI career field. Data warehouses make up a large portion of BI ecosystems in companies. Doesn't matter if you're implementing a BI initiative, reporting out of existing infrastructure, or writing logic to move data from transactional systems into OLAP systems this section provides the base knowledge to do those jobs. Below is a YouTube video from O'Reilly that goes over the steps to create an agile data warehouse and matches the lecture materials very well.
One other thing to note for this section that I feel is important is the notion of traditional BI vs Modern BI. In my past blog post I provided an example of what a modern ecosystem would look like, but I'd like to go into a little more detail here. Traditional BI relies on purely static data inside data warehouse while modern BI still uses those systems but also introduces additional infrastructure for "streaming analytics". This is an attempt to make data driven decisions in the moment instead of after the fact. Here is an executive brief from Informatica introducing SA and it's benefits.
Module 2 took us into the world of web analytics specifically with the tool Google Analytics, which is a type of data analysis. Before diving into web analytics I want to note that the data analyst role isn't specific to BI and can be found in all kinds of business groups. Web analytics was defined in our lecture as "The measurement, collection, analysis, and reporting of internet data for the purpose of understanding web usage." Below is the web analytics life cycle and the sections it's broken into consist of the 5 Ws: What, who, when, where, and why.
Here are some sample metrics and what they represent that we can use to understand our web analytic data:
- Number of Visitors - Indicates the number of unique visitors over a specific time
- Exit Rate - The fraction of visitors who leave the site from a specified web page
- Bounce Rate - Fraction of visitors who leave the website from a particular page (single page view visits)
- Conversion Rate - Portion of visits that results in goal achievement
- Task Completion Rate - Portion of visitors who were able to successfully complete a specified task on the website.
Google Analytics gives website owners a pain free way to track and access their traffic data. By just adding a simple java script line to the individual web page source codes Google will automatically track the data and then makes it accessible through their online portal. The biggest draw of this tool is it provides information to all online businesses that previously was only found in larger companies where they had a much bigger budget for tech. This is extremely important as the trend to eCommerce from brick-and-mortar shopping continues to shift. Capitalizing on this information can give a company a leg up against their competition in any industry.
The last module covered in this class was on network analysis, which is a small look into what you might expect a data scientist to do. However, with tools such as Gephi readily available we can all do some network analysis once we get the proper data 😊. If you're interested in checking out your Facebook social media data Netvizz can help!
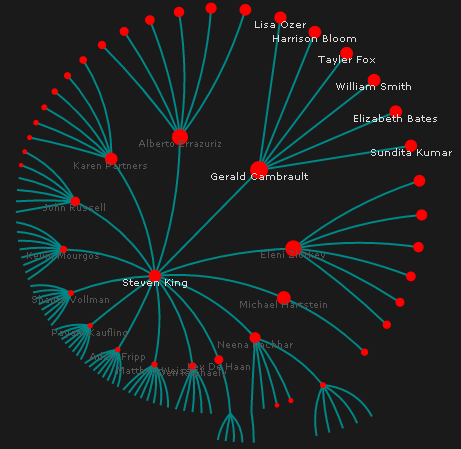
Networks are composed of two parts: Nodes and Edges. Nodes represents the entities of a network, such as employees. The edges represent the relationship between nodes, such as "works under". Each of these parts can store contextual data as well such as hire date, department, salary, etc. Once the data has been captured in a nodes and edges format it can be fed into tools like Gephi to visualize and analyze. Taking the example nodes and edges and visualizing them might give us a graph like the following representing an organization chart.

After all is said and done I can definitely say this is my favorite class of the program (so far!). I'm excited to apply the concepts, especially module 1, to some side projects I have in mind. First one is taking my lifting data I started to track and then use the rest of our Tableau trial to turn it into a dashboard. Another one is a sample data warehouse idea I got from a friend. He's thinking of opening a trading card shop in our hometown and it got me thinking about the possibilities of BI in small business! That one might be a bit tricky since I'd have to assume everything about the systems and data so we will see. I'd love to hear about any of your projects and ways you plan on applying the class materials as well.

I really have to agree that this has been my favorite class. The assignments were very thorough and gave me some real experience with analyzing data. Gephi and I had some words but in the end, I came out ahead. Congrats on being half way done! It seems everyone found the GoT network out on the web! =-)
ReplyDelete